CLEARING THE AIR: How Electric Vehicles and Cleaner Trucks Can Help Reduce Pollution, Improve Health and Save Lives in the Greater Toronto and Hamilton Area
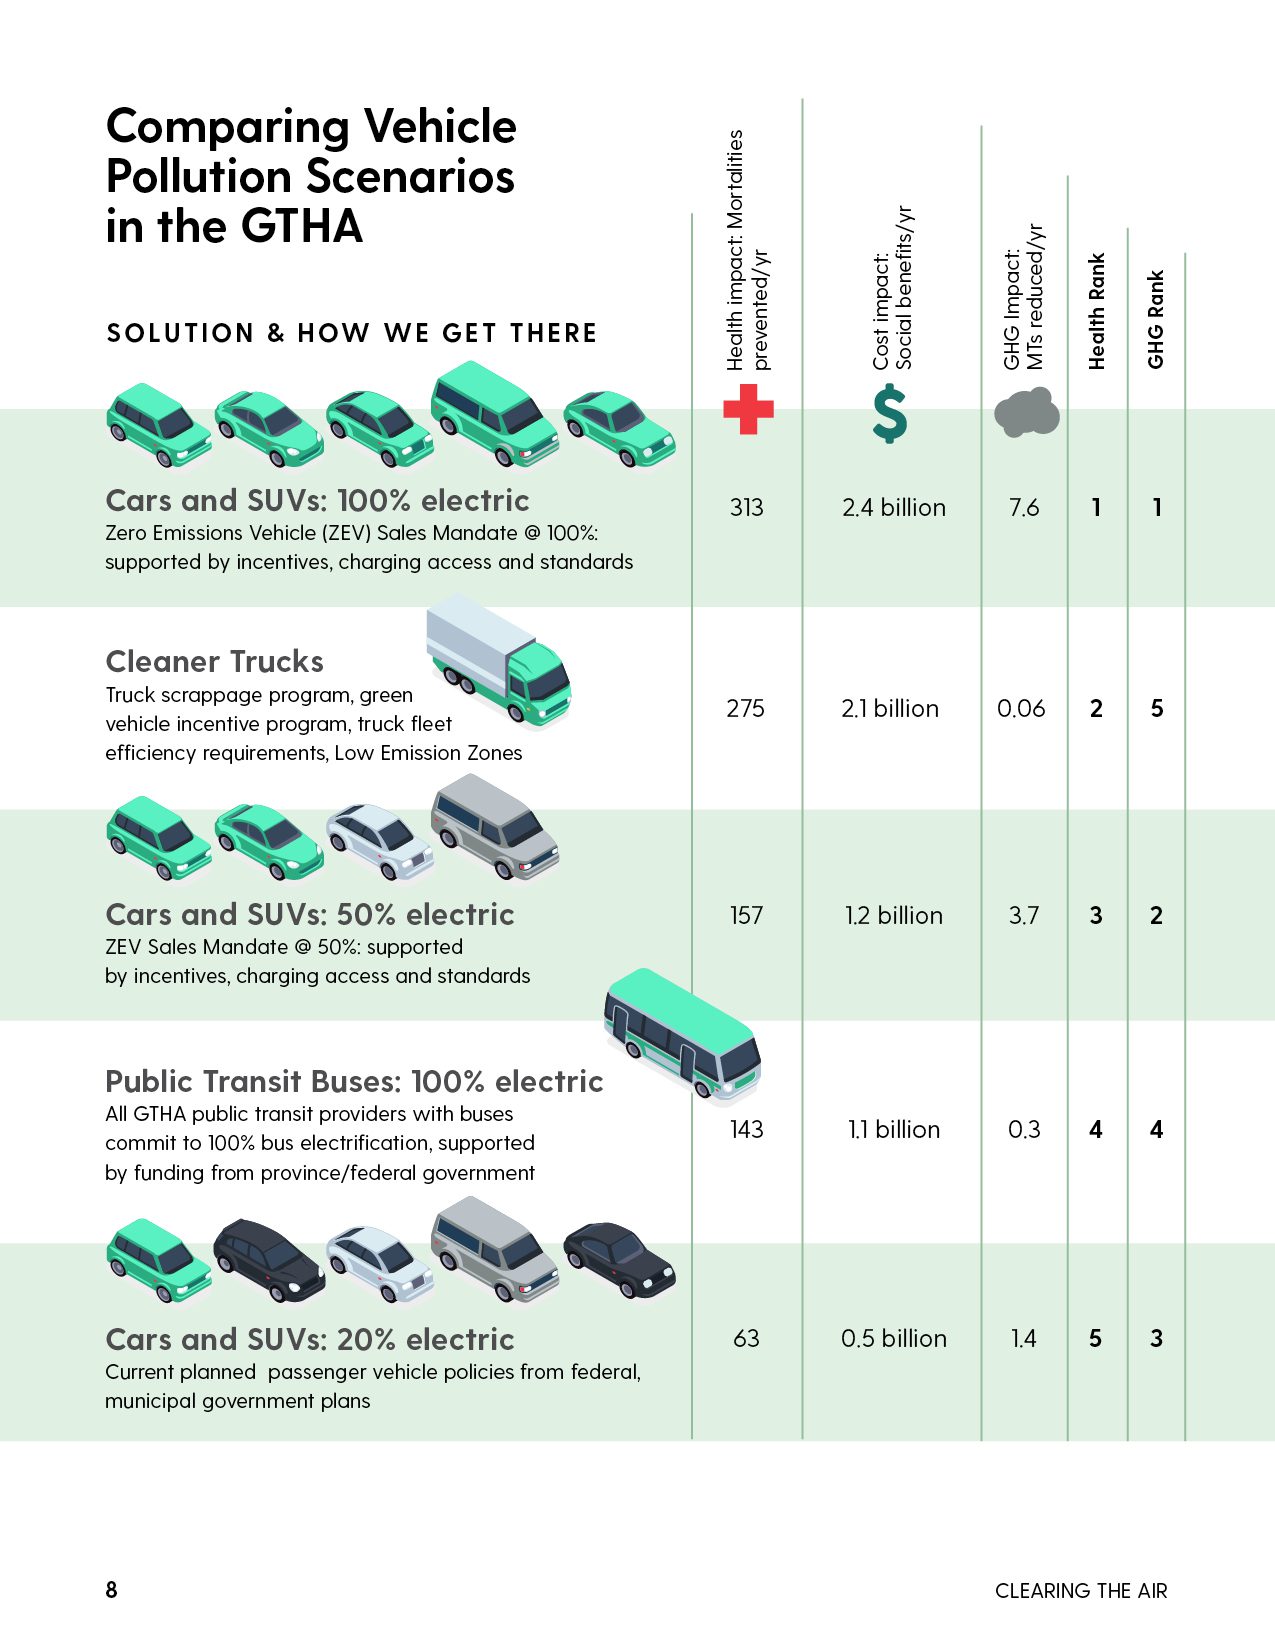
People in the Greater Toronto Hamilton and Area (GTHA) use vehicles every day to travel to work, go to school, move goods, and do many other tasks. This vehicle travel emits air pollution that contributes to illness and premature deaths, and greenhouse gas emissions that are responsible for climate change. We've modelled five scenarios (plus a base case of current conditions) to compare the health benefits of reducing traffic pollution from cars and SUVs, trucks, and buses. Each scenario explores what the GTHA can look like with a specific mix of cleaner vehicles, and how this shift impacts air pollution, improves health, and reduces greenhouse gas emissions in the region.
Check out interactive maps below!
You can check out the interactive maps below to compare how each scenario can reduce air pollution and greenhouse gas emissions to improve health and save lives.
Interactive Maps!
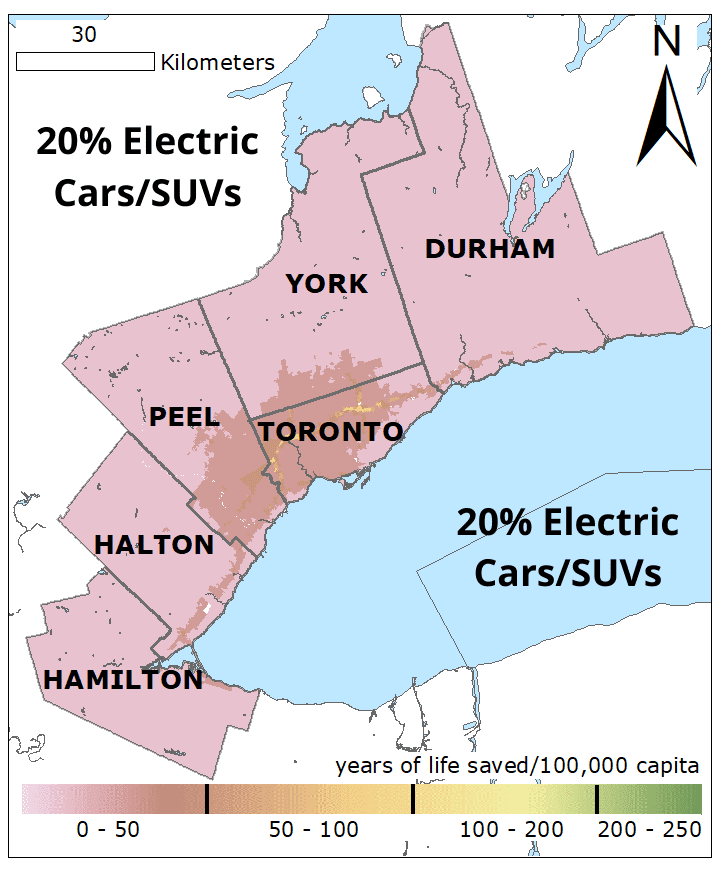
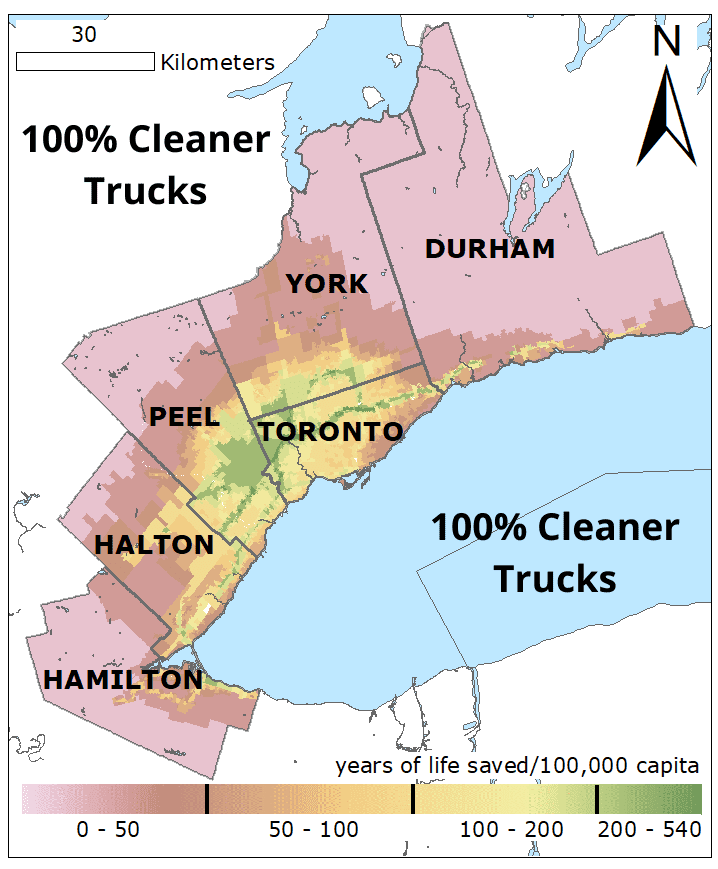
YEARS OF LIFE SAVED IN THE GTHA EVERY YEAR PER 100,000 INHABITANTS BY MODELLED SCENARIO
Use the sliding function to compare two maps and see which scenario will save more years of life. The more green on the map, the more years of life that scenario saves every year.
Select the two maps you want to compare
20% Electric Cars/SUVs

100% Electric Public Transit Buses

100% Electric Cars/SUVs

50% Electric Cars/SUVs
100% Cleaner Trucks
DAILY TRAFFIC-RELATED GREENHOUSE GAS EMISSIONS IN THE GTHA BY MODELLED SCENARIO
Use the sliding function to compare two maps and see which scenario reduces more greenhouse gas emissions every day..
Select the two maps you want to compare

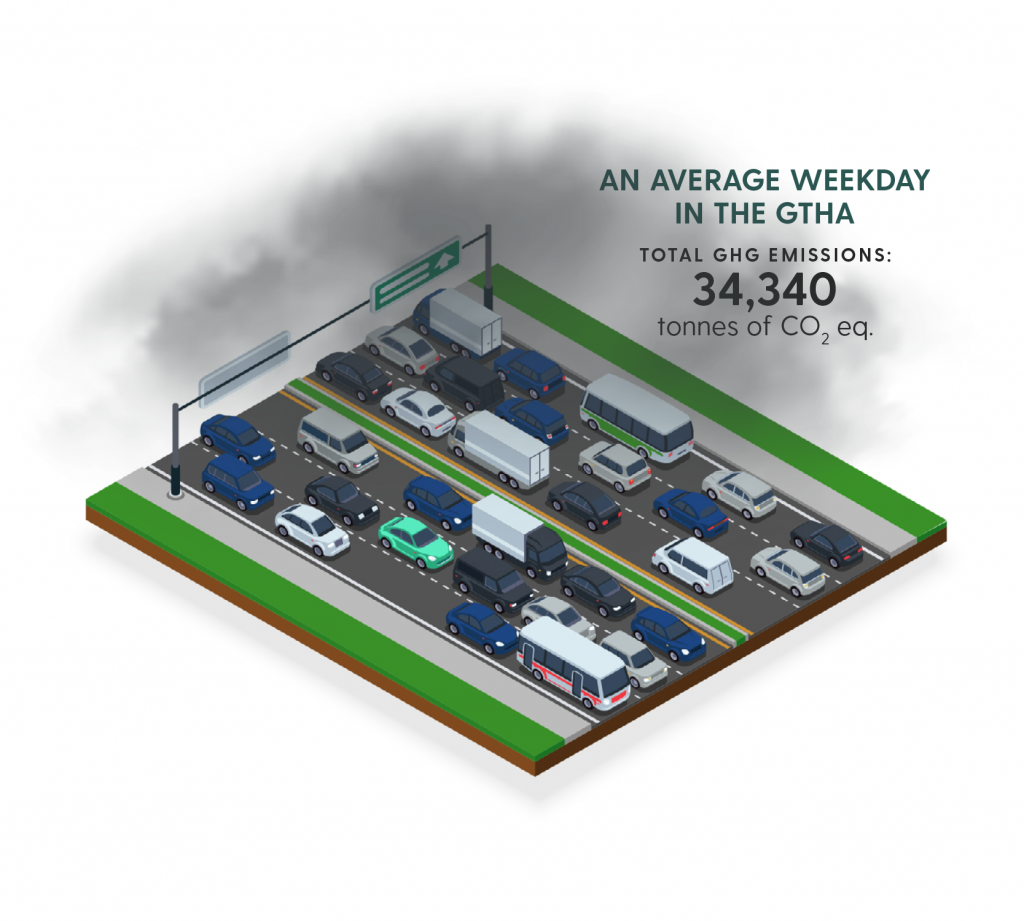
Average Weekday in the GTHA
Total GHG Emissions: 34,340 tonnes of CO2 eq.

100% of public transit buses are electric
Total GHG Emissions: 33,370 tonnes of CO2 eq.

50% of cars/SUVs are electric
Total GHG Emissions: 22,600 tonnes of CO2 eq.

100% of trucks are cleaner (2008 technology standards)
Total GHG Emissions: 34,150 tonnes of CO2 eq.

20% of cars/SUVs are electric
Total GHG Emissions: 29,763 tonnes of CO2 eq.

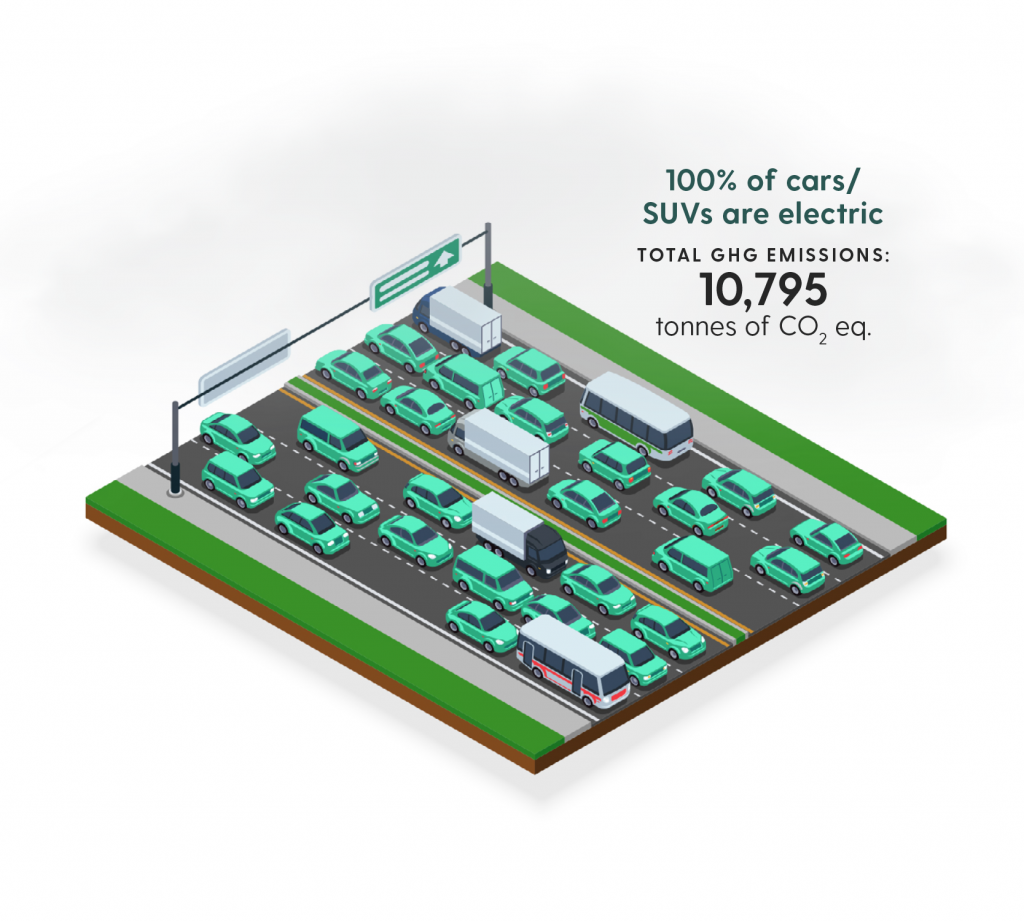
100% of cars/SUVs are electric
Total GHG Emissions: 10,795 tonnes of CO2 eq.
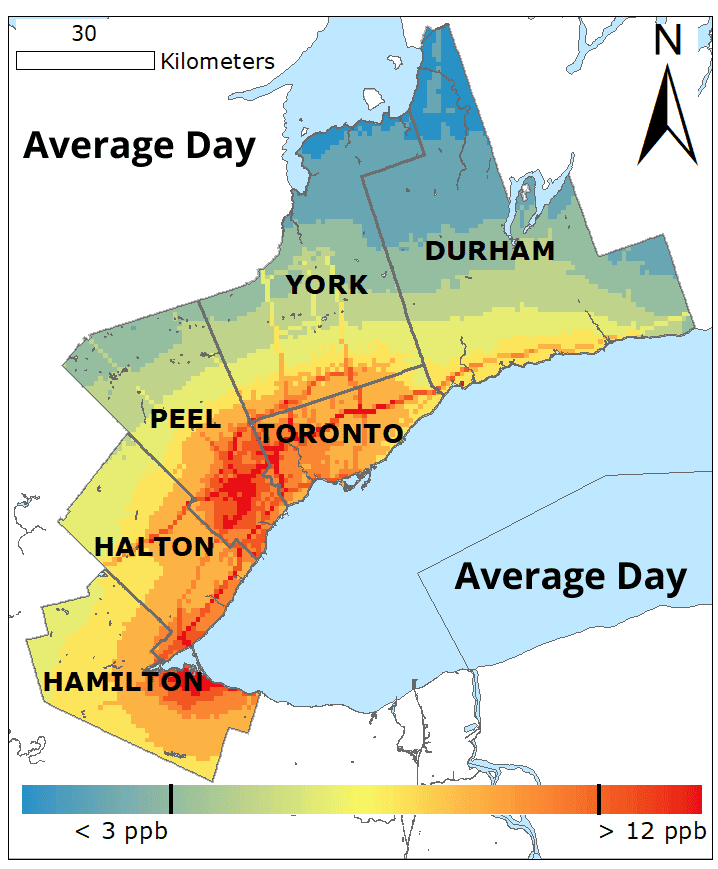
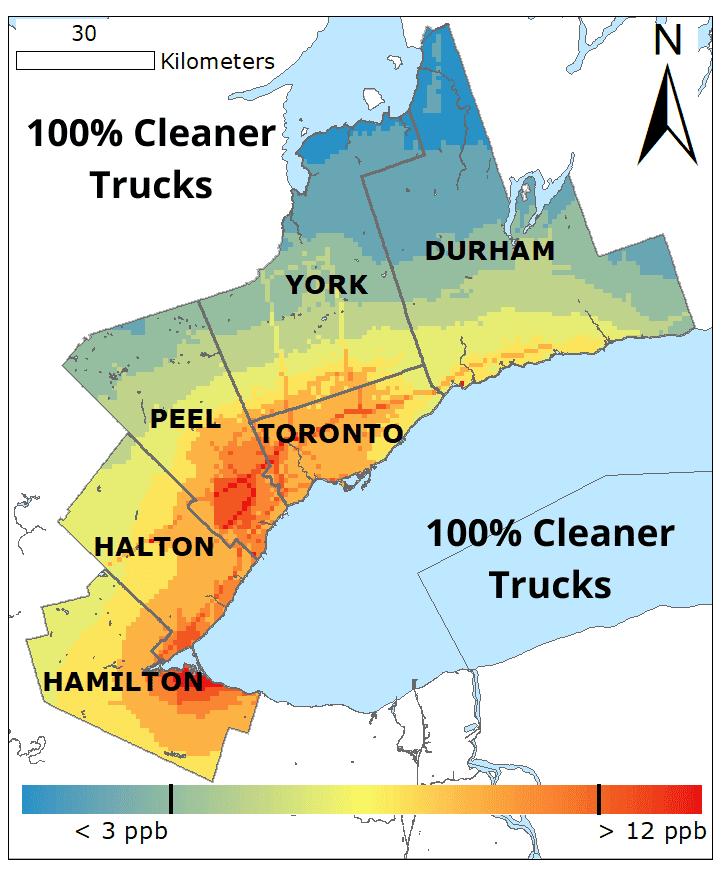
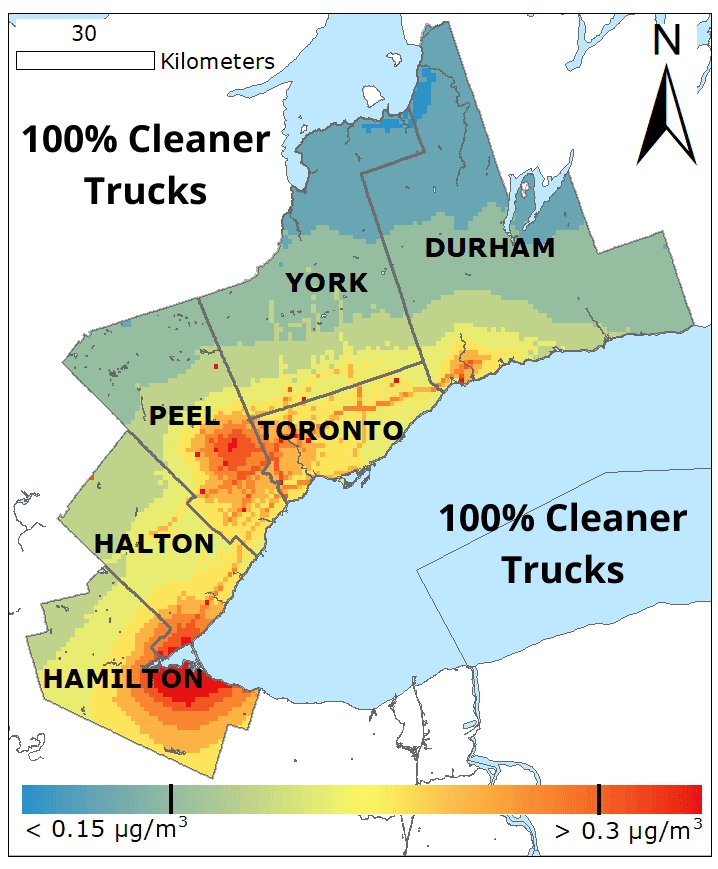
NITROGEN DIOXIDE CONCENTRATIONS IN THE GTHA BY MODELLED SCENARIO
Use the sliding function to compare two maps and see which scenario will better reduce concentrations of harmful nitrogen dioxide. Less red on the map means lower concentrations of nitrogen dioxide and cleaner air.
Select the two maps you want to compare
Average Day

50% Electric Cars/SUVs

100% Electric Cars/SUVs

20% Electric Cars/SUVs

100% Electric Public Transit Buses
100% Cleaner Trucks
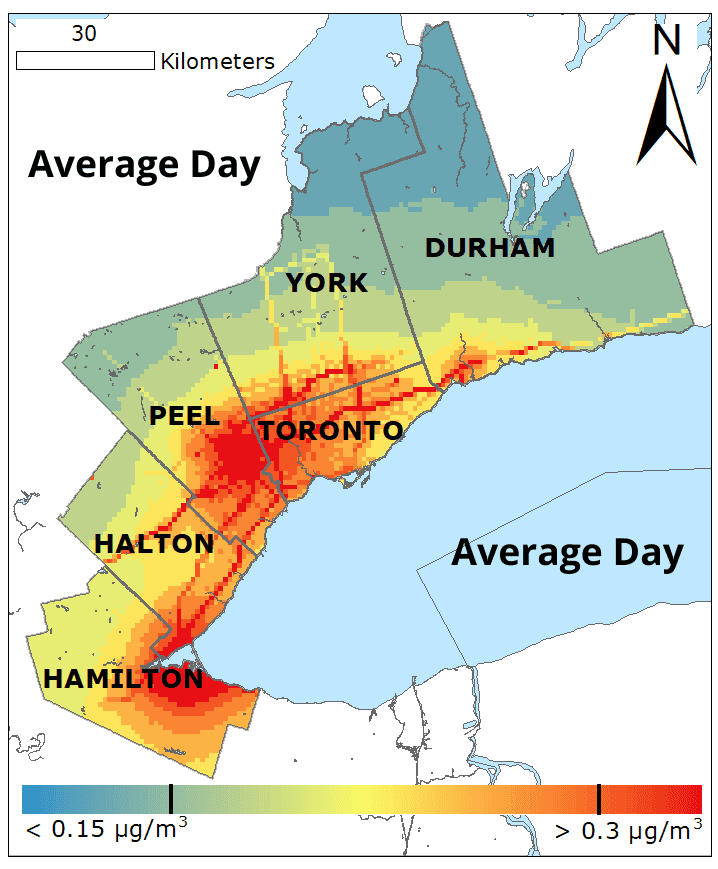
BLACK CARBON CONCENTRATIONS IN THE GTHA BY MODELLED SCENARIO
Use the sliding function to compare two maps and see which scenario will better reduce concentrations of harmful black carbon.. Less red on the map means lower concentrations of black carbon and cleaner air.
Select the two maps you want to compare
Average Day

50% Electric Cars/SUVs

100% Electric Cars/SUVs

20% Electric Cars/SUVs

100% Electric Public Transit Buses
100% Cleaner Trucks